Lesson 3: p5.js Serial In
Table of Contents
- Processing and p5.js
- Learning p5.js
- p5.js, Web Serial, and Arduino
- Lesson Summary
- Exercises
- Next Lesson
Video. Where we’re headed: GraphIn, a p5.js sketch that graphs live Arduino sensor data in the browser in real time (here, from a potentiometer). (live page, code)
We’ve only started to scratch the surface of what’s possible when combining Arduino with computers. In this lesson (and the next), we’re going to use a creative coding tool called p5.js to help demonstrate this potential. It should be fun! 🎨
In this lesson, you will learn:
- What Processing and p5.js are, and why they’re great tools for physical computing
- How to set up a p5.js development environment (online editor and VSCode)
- How to receive serial data from Arduino in a p5.js sketch (
Arduino → Computer)- How to parse incoming serial data and use it to drive interactive visuals
- How to build a real-time sensor graph in p5.js
Processing and p5.js
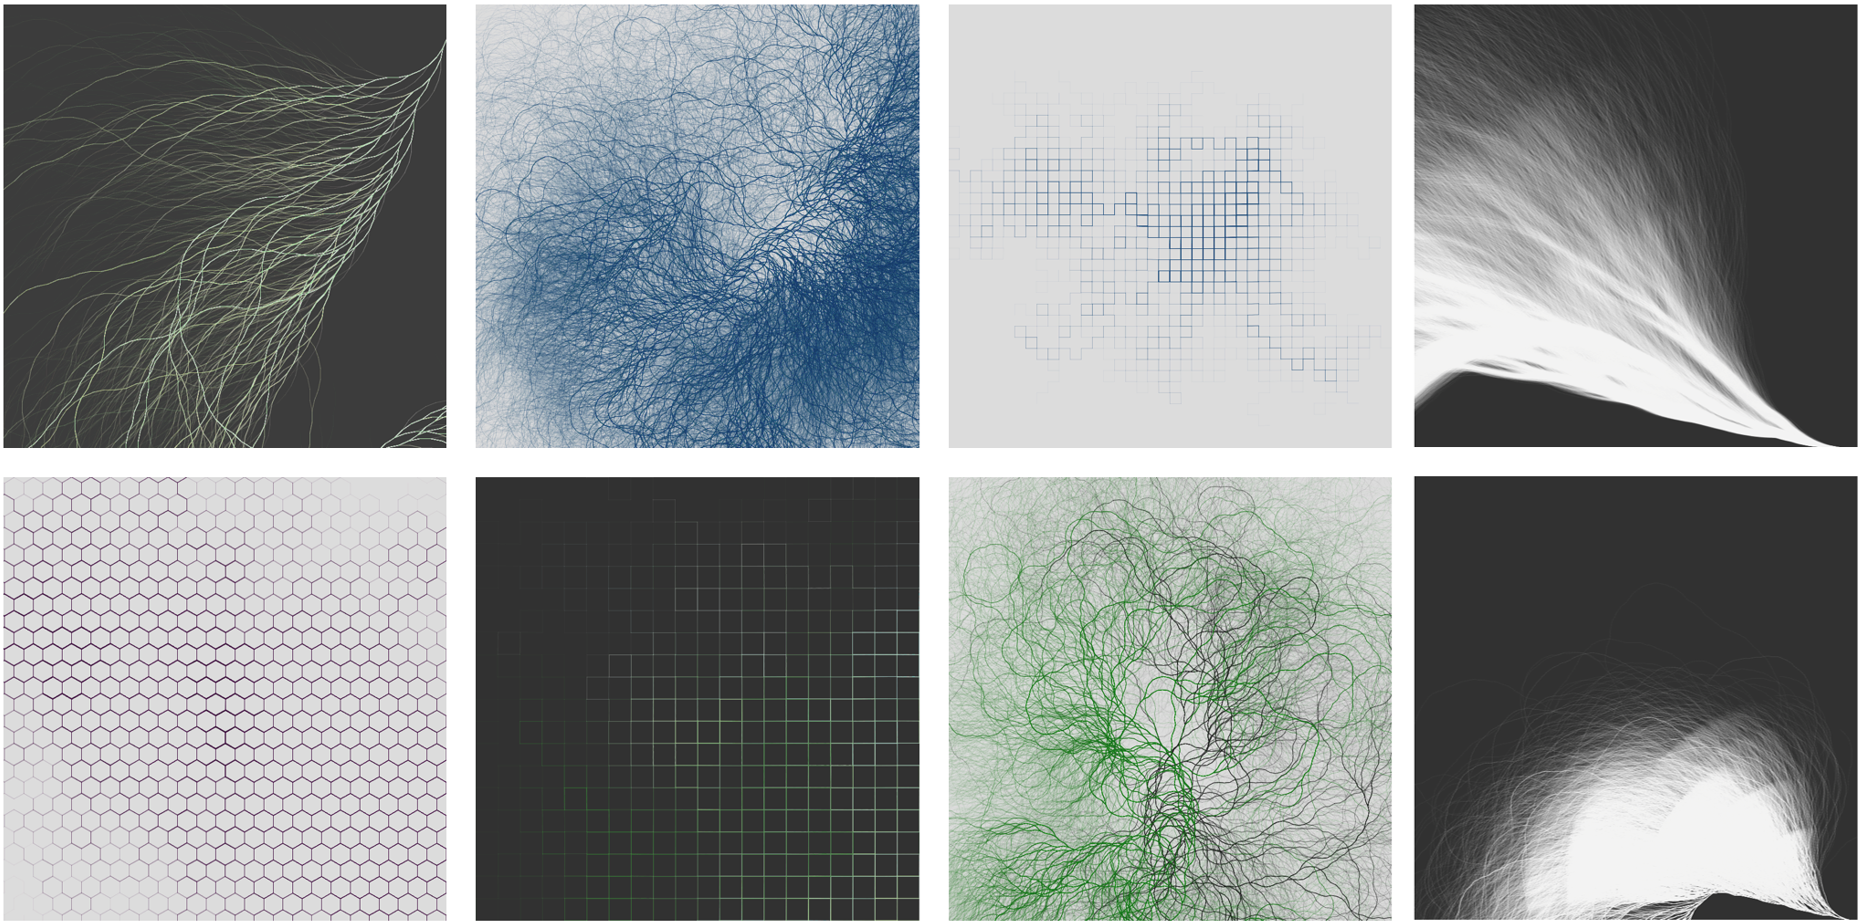 Figure. Variations on the Collatz Conjecture by user /u/ideology_boi on Reddit. Coded in ~200 lines in Processing (code link). Inspired by the Coding Train walkthrough video “Collatz Conjecture”.
p5.js is based on Processing, which was started by Casey Reas and Ben Fry at MIT in 2001 to provide an accessible programming tool for combining art and technology. From the Processing website:
Since 2001, Processing has promoted software literacy within the visual arts and visual literacy within technology. There are tens of thousands of students, artists, designers, researchers, and hobbyists who use Processing for learning and prototyping.
Processing includes both an IDE and a Java-based library that lets designers, artists, makers, and engineers sketch with code. It creates a safe, accessible, and easy-to-use coding sandbox to prototype, experiment, and play. Think of Processing like a creative canvas for coders!
Processing simplifies graphical programming and abstracts away complexity. In fact, when you write code in Processing, you don’t even need to know that you’re using Java! This design philosophy may feel familiar—the Arduino framework similarly abstracts away C/C++ complexity. This is not by accident: the Arduino IDE and programming paradigm is based on Processing!
 Figure. The Arduino IDE is based on Processing (source). Right-click on image and select “Open Image in New Tab” to zoom in.
Creating interactive graphics in Processing requires only a few lines of code. For example, here we’ve created a small painting program in ~10 lines:
Video. A ten-line drawing program written in Processing.
It’s hard to overemphasize Processing’s impact on digital artists, creative coders, and CS education. Processing is used by professionals and hobbyists alike, and has produced work featured in music videos (e.g., Radiohead’s House of Cards), exhibited at art galleries, and featured in movies, TV, and other media. Processing is open source and there is an ethos of sharing work and learning from others—see the Reddit Processing community, for example, or read more at the Processing Foundation.
Video. The music video for Radiohead’s House of Cards was created entirely using data visualization—no cameras or lights were used. The 3D data was captured using LIDAR and structured light scanners, then rendered in Processing. See Aaron Koblin’s writeup here and the source code + data on GitHub.
p5.js
In 2008, John Resig (the creator of jQuery) ported Processing to JavaScript, which allowed creators to use Processing without a Java plugin (Wikipedia). While an early success—adopted by teaching programs like Khan Academy—the port came a bit early in HTML+JavaScript history.
In 2013, Lauren McCarthy (media artist and professor at UCLA) created p5.js, which is now the officially supported JavaScript-based library for Processing and renders natively to the Canvas element. Similar to the original Processing mission, p5.js is:
a JavaScript library for creative coding, with a focus on making coding accessible and inclusive for artists, designers, educators, beginners, and anyone else! p5.js is free and open-source because we believe software, and the tools to learn it, should be accessible to everyone.
Even though p5.js is in JavaScript rather than Java—two languages that are similarly named but have absolutely no relation—the p5.js API is nearly identical to Processing. So it’s very easy to translate pre-existing Processing code to p5.js. Similar to Processing, p5.js abstracts away much of the complexity of JavaScript and lets you focus on interactive graphics and visualizations. Here’s a simple p5.js program—notice the similarities to Processing?
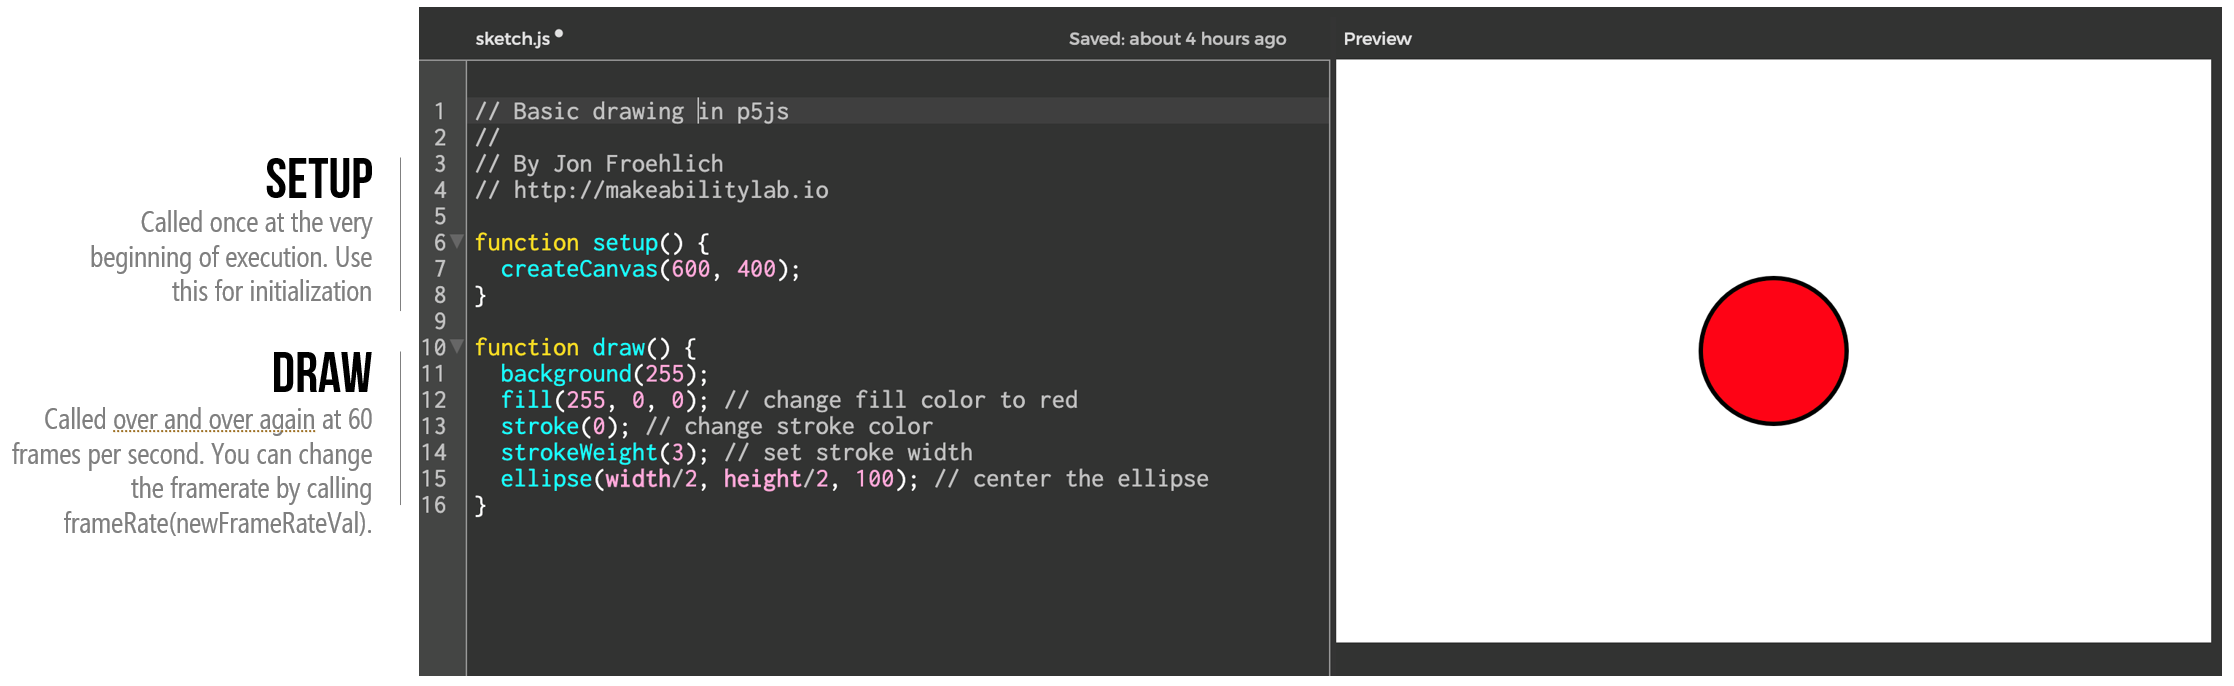
And here’s the same black-and-white drawing program we wrote in Processing above, now in p5.js:
Video. A ten-line drawing program written in p5.js. View, edit, and play with the code via the online editor.
p5.js’s online editor
You can write p5.js code right from your web browser! p5.js also has a convenient online editor, which makes it easy to rapidly write, test, iterate on, and share code. In the editor, go to File → Share and select one of the options.
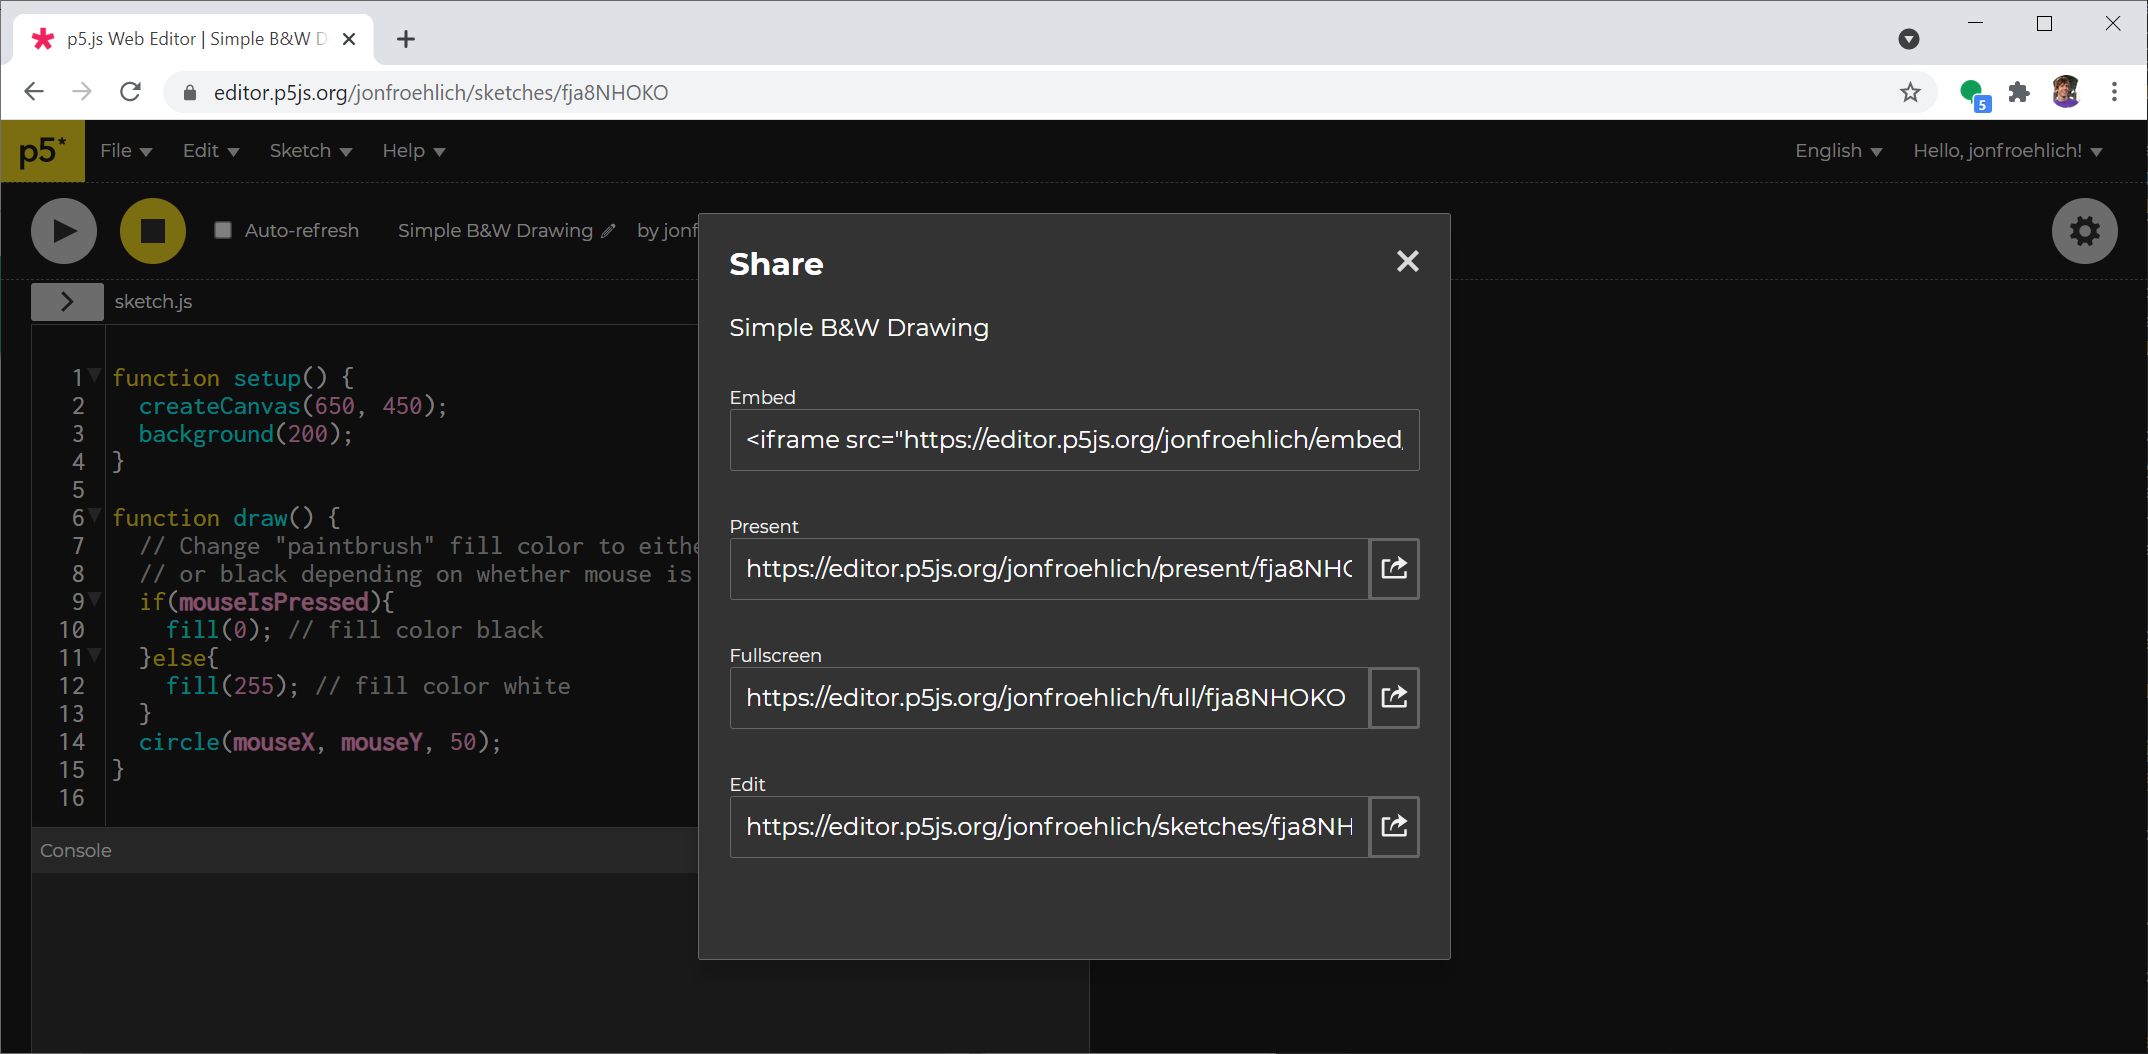 Figure. Sharing options in the p5.js online editor.
You can not only view our code and make edits directly—don’t worry, this won’t affect the original—but you can also embed sketches in other HTML pages. Here we’ve embedded the drawing sketch below! Hold down the mouse to change the “paintbrush” to pure black.
Code. A live embedded version of our simple b&w drawing program in p5.js. View, edit, and play with the code here.
Like Processing, the key concept is to sketch with code—to play, to experiment, to iterate, to rapidly prototype ideas. It’s intellectually freeing!
p5.js examples written in the online editor
Here are some examples we’ve written directly in the p5.js editor. Click any link to see, edit, and run the code. Note that many of these were written while we were still learning p5.js ourselves (and our learning journey never ends!).
- Sound Visualizations
- Santa Landscape Generator
- Cookie Monster Game
- Basic Slider Scroller Game
- Falling Star FFT Game
- Flappy Bird
p5.js 2.0
Note that p5.js is currently undergoing a major transition from version 1.x to version 2.0. This is the biggest change to p5.js since Lauren McCarthy created it in 2013, and it’s worth understanding what’s happening—even though it does not significantly affect our serial communication code. (Indeed, we do not even need p5.js to write JavaScript-based apps with WebSerial).
The p5.js 2.0 project modernizes p5.js to align with how JavaScript has evolved over the past decade. The key changes include:
preload()removed in favor ofasync/await: In 1.x, you loaded images and data in a specialpreload()function. In 2.0, loading functions return Promises and you useasync setup()withawait. This aligns p5.js with standard JavaScript patterns.- Removed redundant functions: Functions that p5.js provided but that JavaScript itself now handles natively (like array manipulation and some string functions) have been removed to keep the library lean.
- Shape API updates: The
beginShape()/endShape()API has been reworked for more flexibility. - Compatibility addons available: For each breaking change, the Processing Foundation provides a compatibility addon so you can keep using 1.x patterns if needed.
Here’s the official timeline:
| Date | Milestone |
|---|---|
| April 2025 | p5.js 2.0 released, opt-in in the p5.js Editor |
| August 2025 | Communication about 1.x end-of-life |
| March 2026 | No further updates to 1.x |
| July–August 2026 | p5.js 2.0 becomes the default in the p5.js Editor |
For this course (Spring 2026), we use p5.js 1.x. The p5.js online editor still defaults to 1.x, and our 100s of example sketches are written for 1.x. When developing locally, we pin to a specific 1.x version in our
index.htmlto avoid surprises (see the template code below).The good news: our serial communication code works identically on both 1.x and 2.0. The
setup(),draw(),createCanvas(), and all the graphics functions we use are unchanged. The breaking changes (preload()removal, data structure functions) don’t affect serial sketches.If you’d like to explore p5.js 2.0, visit beta.p5js.org. Read the official transition blog post and the compatibility guide for details on migrating.
Learning p5.js
After conquering the OLED display and graphics rendering, p5.js will feel both familiar and infinitely more expressive. Processing (for Java) and p5.js (for JavaScript) are some of our favorite programming environments, and we can’t wait to share p5.js with you!
There are some amazing learning resources on the web. Rather than replicate them, we share them here:
-
Johannes Preis’ Introduction to p5.js 1.0 — an excellent introduction to the coding editor, basic graphic rendering, and interactivity but focused on p5.js 1.0.
-
The official p5.js Tutorials and plethora of official p5.js examples.
-
The Coding Train’s Programming with p5.js by Daniel Shiffman — probably the best, most interesting, fun, and accessible creative coding videos on the web.
Developing in p5.js
You can develop p5.js projects either in the online editor or in your favorite web dev environment. For local development, we strongly recommend VS Code. We often switch between the online editor—for quick sketches and easy sharing—and VSCode for larger or more complicated projects.
Setting up p5.js in VSCode
We used Visual Studio Code in our previous lesson. By now, you should have VSCode installed with the Live Server extension. If not, follow these instructions and do so now!
Using a p5.js VSCode extension
The easiest way to set up VSCode for p5.js is to install an extension like p5.vscode by Sam Lavigne. This extension auto-creates a project folder with the required HTML/CSS/JavaScript files, hooks up autocompletion for p5.js functions, supplies a local copy of the p5.js library, and bundles Live Server. To create a new project, open the Command Palette (Ctrl+Shift+P on Windows, Cmd+Shift+P on Mac) and type Create p5.js Project, then select an empty folder.
The p5.vscode extension scaffolds p5.js 1.x projects and has not been actively updated in some time, but it still works well for our purposes. If you later want to create p5.js 2.x projects in VSCode, see the newer p5.js 2.x Project Generator extension.
If you’re a VSCode or web dev novice, we recommend this solution!
Video. Spending time setting up VSCode for p5.js is worth the investment. As the video shows, you get autocomplete, inline documentation, and more. You can do this with the p5.vscode extension or via a manual setup, described next.
Manually setting up VSCode for p5.js
If you prefer to configure VSCode manually, the key challenge is getting autocompletion for p5.js keywords. p5.js is written in vanilla JavaScript rather than TypeScript, so VSCode’s IntelliSense doesn’t work out of the box. The fix is to install the p5.js TypeScript type definitions so that VSCode knows about setup(), draw(), createCanvas(), and all other p5.js functions.
First, open a terminal in your project folder and run:
npm init -y
npm install --save-dev @types/p5
Then create a jsconfig.json file in your project root:
{
  "compilerOptions": {
    "types": ["p5/global"]
  }
}
That’s it! VSCode will now provide autocomplete, hover documentation, and parameter hints for all p5.js functions. You’ll still need Live Server to serve your sketch in a browser.
The
@types/p5package provides type definitions for p5.js 1.x. When p5.js 2.x becomes the standard, you’ll install thep5npm package directly instead—it ships its own type definitions.
p5.js, Web Serial, and Arduino
OK, let’s get started making stuff! We’ll begin with Arduino sending data to p5.js via serial (Arduino → Computer).
Starter template code
To make it easier to build p5.js web apps with Web Serial, we’ve created a basic p5.js serial template. You can view it and duplicate it via the p5.js online editor or from our GitHub repo (SerialTemplate).
The baud rate in your JavaScript program and your Arduino program must match. In JavaScript, set this with
let serialOptions = { baudRate: 115200 };. In Arduino, useSerial.begin(115200). If they don’t match, you’ll get garbled data or nothing at all. See our Intro to Serial lesson for details.
Using an ESP32? Remember to use
115200baud (not 9600). Also, the ESP32 has a 12-bit ADC (0–4095) instead of the Arduino Uno/Leonardo’s 10-bit ADC (0–1023). If you’re normalizing analog input to [0, 1], useMAX_ANALOG_INPUT = 4095instead of1023.
Circle size app
Let’s build a simple Arduino → Computer p5.js web app that reads in a single floating point number between [0, 1] (as text-encoded data) and draws an appropriately sized circle. We’ll use the Arduino program AnalogOut.ino and the web app called CircleSizeIn (live page). The full app experience looks like this:
Video. The p5.js app CircleSizeIn (live page, code), which receives serial input from the Arduino running AnalogOut.ino. We use a potentiometer on Pin A0 as analog input.
Let’s get building!
The Arduino code: AnalogOut.ino
The Arduino program is simple: read an analog value and transmit it via serial as a normalized fraction between [0, 1].
We use analogRead() on Pin A0 and divide the reading by the maximum analog input value (1023 on the Arduino Uno and Leonardo with 10-bit ADCs, or 4095 on ESP32 boards with 12-bit ADCs). We set the baud rate to 115200.
const int DELAY_MS = 5;

const int ANALOG_INPUT_PIN = A0;
const int MAX_ANALOG_INPUT = 1023;

int _lastAnalogVal = -1;

void setup() {
  Serial.begin(115200); // set baud rate to 115200
}

void loop() {

  // Get the new analog value
  int analogVal = analogRead(ANALOG_INPUT_PIN);

  // If the analog value has changed, send a new one over serial
  if(_lastAnalogVal != analogVal){
    float sizeFrac = analogVal / (float)MAX_ANALOG_INPUT;
    Serial.println(sizeFrac, 4); // 4 decimal point precision
  }

  _lastAnalogVal = analogVal;
  delay(DELAY_MS);
}
Code. The full code is AnalogOut.ino in our GitHub.
This should all make sense—there’s nothing new here. We’ve been doing this since the early Intro to Arduino lessons.
The p5.js code: CircleSizeIn
We’ll build up the p5.js app step-by-step. You can do this in the p5.js online editor or in VSCode. Our instructions are for VSCode.
Setup initial p5.js template
Start with a brand new blank project with index.html, css/style.css, and sketch.js files. We put them in a folder called CircleSizeIn but this is up to you.
If you have p5.vscode installed, you can create a new project from the Command Palette (Ctrl+Shift+P → Create p5.js Project). If you do this, make sure you add our serial library to the <head> in index.html:
<script src="https://cdn.jsdelivr.net/gh/makeabilitylab/js@main/dist/makelab.serial.iife.js"></script>
Or you can build up the required files manually. The index.html should look like:
<!DOCTYPE html>
<html>

<head>
  <script src="https://cdn.jsdelivr.net/npm/p5@1.11.13/lib/p5.js"></script>
  <script src="https://cdn.jsdelivr.net/gh/makeabilitylab/js@main/dist/makelab.serial.iife.js"></script>
  <link rel="stylesheet" type="text/css" href="css/style.css">
  <meta charset="utf-8">
</head>

<body>
  <script src="sketch.js"></script>
</body>

</html>
Notice that we’re pinning to p5.js version 1.11.13 (
p5@1.11.13) rather than using the latest version. This ensures your sketch continues to work even after the p5.js Editor defaults to 2.0 in August 2026. You can also usep5@1to always get the latest 1.x release.
The css/style.css file:
html, body {
  margin: 0;
  padding: 0;
}

canvas {
  display: block;
}
And the sketch.js file:
function setup() {
  createCanvas(400, 400);
}

function draw() {
  background(100);
}
Now save and load the page with Live Server. It should look like this:
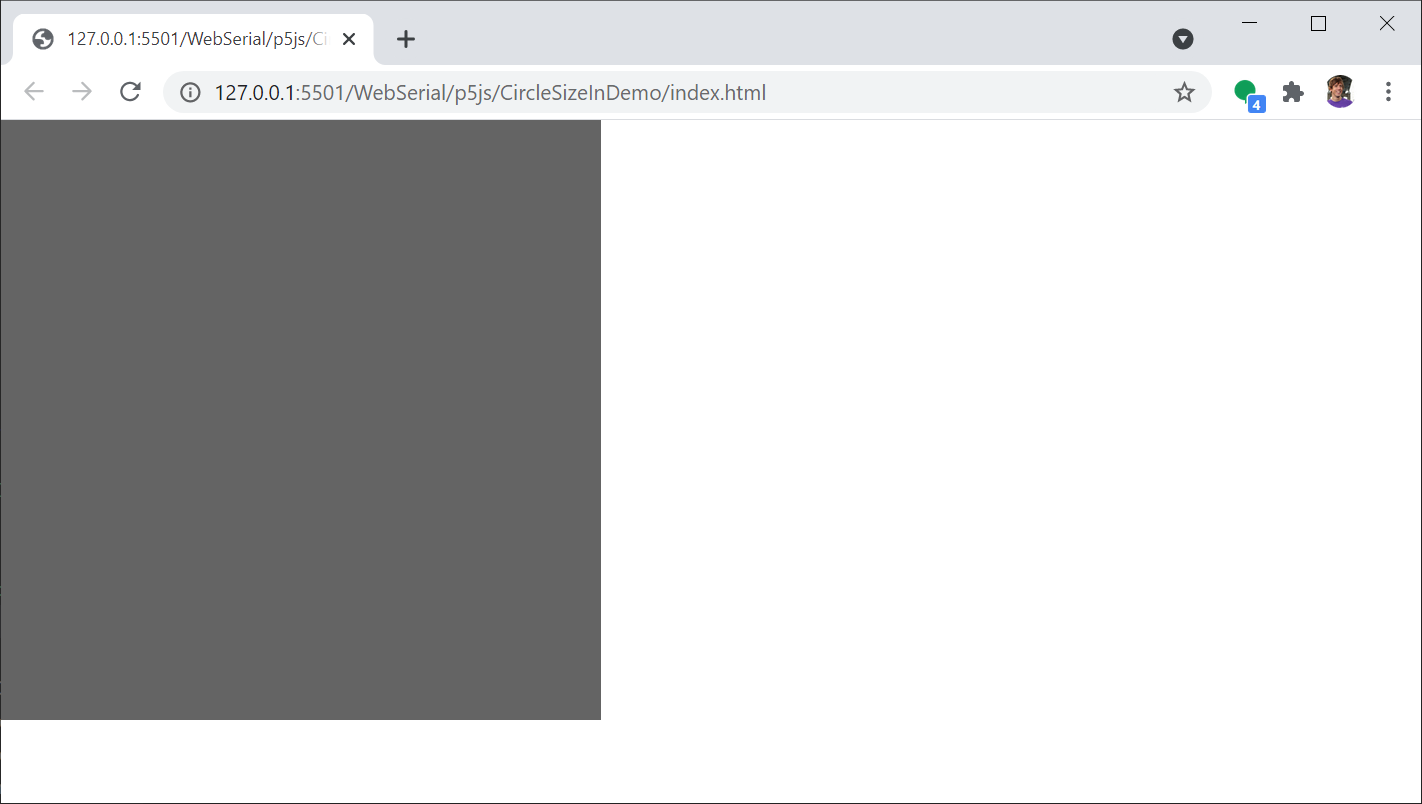 Figure. An initial template for web development with p5.js and Web Serial.
If your page does not load or does not look like this, study our blank template here (live page, code).
Draw a circle
Let’s update sketch.js to draw a white circle of diameter 50 in the canvas center. We’ll use fill() to set the fill color and noStroke() to turn off outlining.
function setup() {
  createCanvas(400, 400);
}

function draw() {
  background(100);

  noStroke(); // turn off outline
  fill(250); // white circle

  // Get x,y center of drawing Canvas
  let xCenter = width / 2;
  let yCenter = height / 2;
  let circleDiameter = 50;
  circle(xCenter, yCenter, circleDiameter);
}
It should look like this:
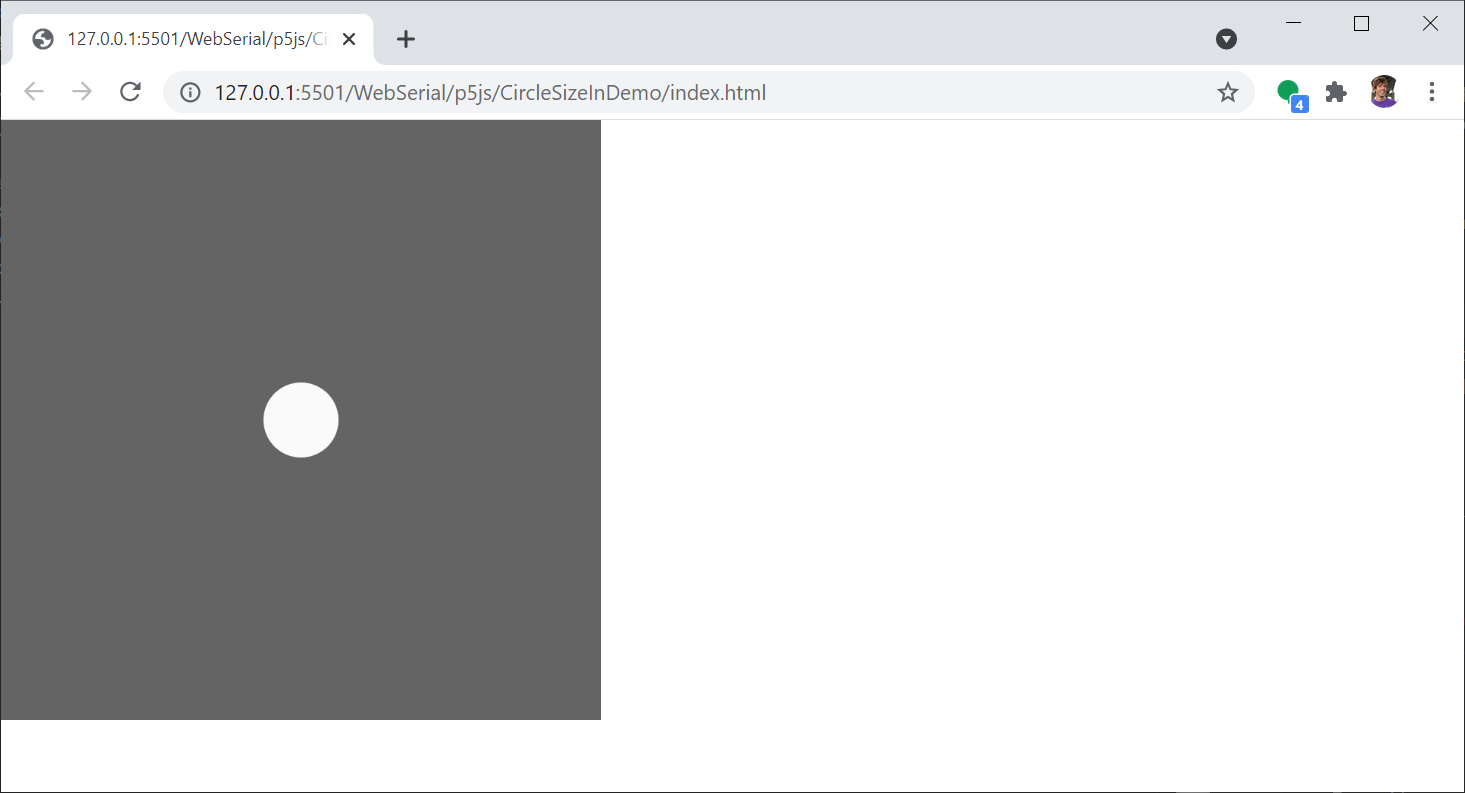
Or here’s a live demo from the p5.js online editor.
Make circle dynamically sized
Now let’s make this sketch interactive! We’ll set the circle’s size based on the mouse’s x position. Later, we’ll replace the mouse input with incoming serial data.
function draw() {
  background(100);

  noStroke(); // turn off outline
  fill(250); // white circle

  // Get x,y center of drawing Canvas
  let xCenter = width / 2;
  let yCenter = height / 2;

  // Set the diameter based on mouse x position
  const maxDiameter = min(width, height);
  let shapeFraction = mouseX / width;
  let circleDiameter = maxDiameter * shapeFraction;
  circle(xCenter, yCenter, circleDiameter);
}
It should look something like this:
Or here’s a live demo from the p5.js online editor.
Add in Web Serial and callback functions
Now we can add serial functionality. This is very similar to the previous lesson, but we’ll add the code to sketch.js rather than inline in the HTML.
First, add global variables to the top of sketch.js:
let shapeFraction = 0; // tracks the new shape fraction off serial
let serial;            // the Serial object
let serialOptions = { baudRate: 115200 };
let pHtmlMsg;          // used for displaying messages via html (optional)
Then create the Serial object in setup(), set up callbacks, and attempt to auto-connect to previously approved ports:
function setup() {
  createCanvas(400, 400);

  // Setup Web Serial using serial.js
  serial = new Serial();
  serial.on(SerialEvents.CONNECTION_OPENED, onSerialConnectionOpened);
  serial.on(SerialEvents.CONNECTION_CLOSED, onSerialConnectionClosed);
  serial.on(SerialEvents.DATA_RECEIVED, onSerialDataReceived);
  serial.on(SerialEvents.ERROR_OCCURRED, onSerialErrorOccurred);

  // If we have previously approved ports, attempt to connect with them
  serial.autoConnectAndOpenPreviouslyApprovedPort(serialOptions);

  // Add in a lil <p> element to provide messages. This is optional
  pHtmlMsg = createP("Click anywhere on this page to open the serial connection dialog");
}
Next, add the callback functions:
function onSerialErrorOccurred(eventSender, error) {
  console.log("onSerialErrorOccurred", error);
  pHtmlMsg.html(error);
}

function onSerialConnectionOpened(eventSender) {
  console.log("onSerialConnectionOpened");
  pHtmlMsg.html("Serial connection opened successfully");
}

function onSerialConnectionClosed(eventSender) {
  console.log("onSerialConnectionClosed");
  pHtmlMsg.html("Serial connection closed");
}

function onSerialDataReceived(eventSender, newData) {
  console.log("onSerialDataReceived", newData);
  pHtmlMsg.html("onSerialDataReceived: " + newData);
}
Finally, add mouseClicked() to let the user connect to serial by clicking anywhere on the canvas:
function mouseClicked() {
  if (!serial.isOpen()) {
    try {
      serial.connectAndOpen(null, serialOptions);
    } catch (error) {
      console.error("Serial connection failed:", error);
    }
  }
}
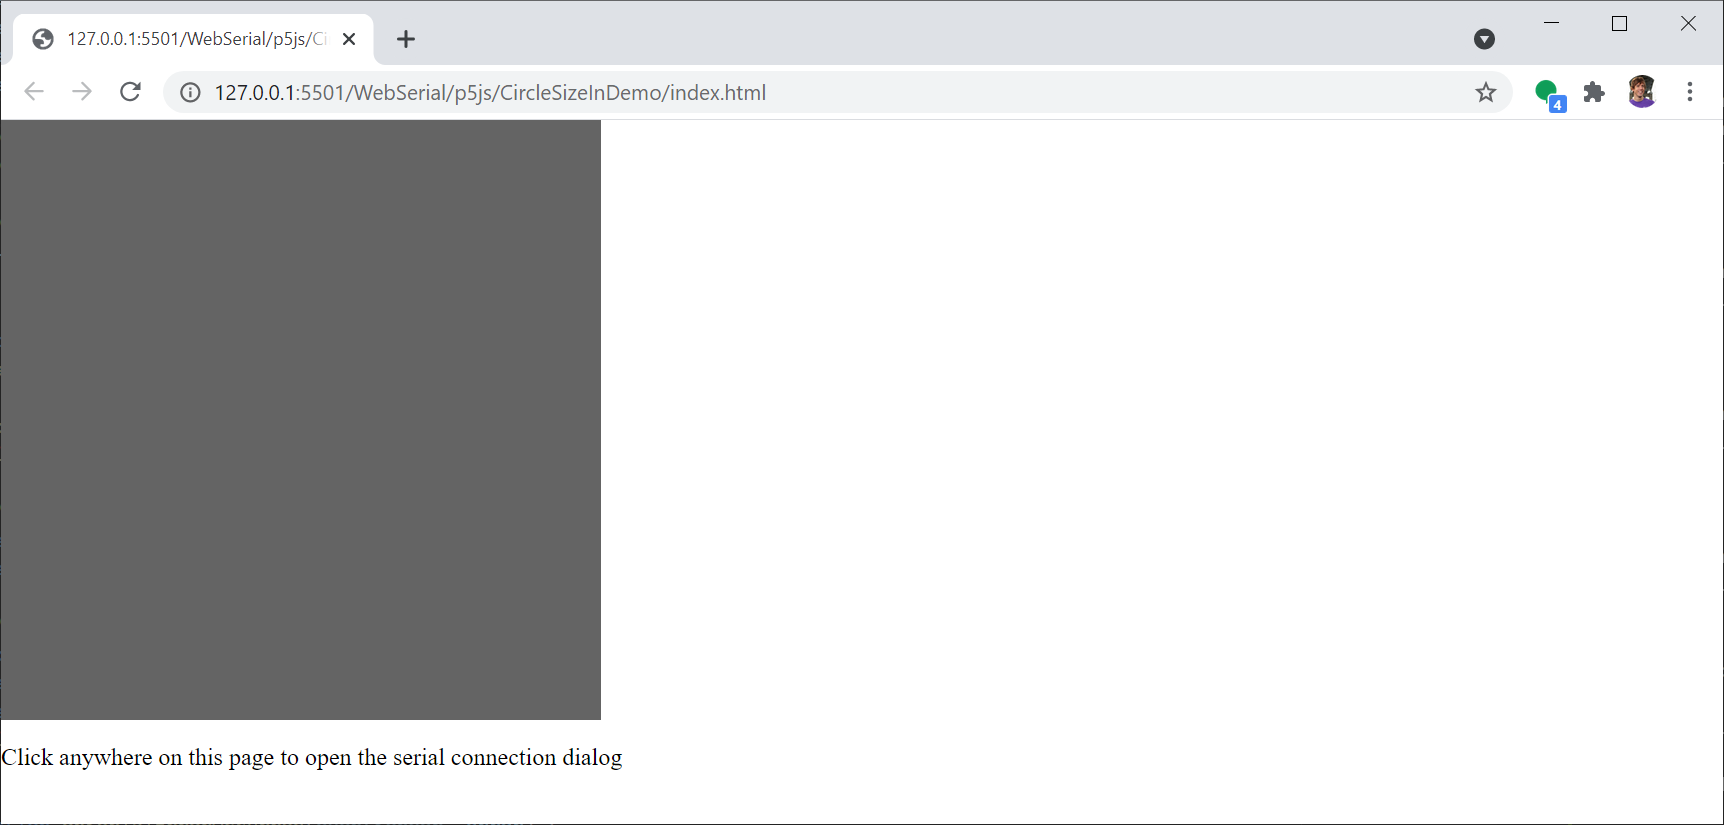
Save and run. The page should look the same except for the new <p> element at the bottom saying “Click anywhere on this page to open the serial connection dialog.”
Parse incoming serial data
Finally, we need to parse the incoming serial data and use it to control the circle size. Update onSerialDataReceived() to store the incoming value:
function onSerialDataReceived(eventSender, newData) {
  console.log("onSerialDataReceived", newData);
  pHtmlMsg.html("onSerialDataReceived: " + newData);

  // Parse the incoming value as a float
  shapeFraction = parseFloat(newData);
}
And in draw(), simply comment out the mouse-based line since shapeFraction is now set by serial:
function draw() {
  background(100);

  noStroke(); // turn off outline
  fill(250); // white circle

  // Get x,y center of drawing Canvas
  let xCenter = width / 2;
  let yCenter = height / 2;

  // Set the diameter based on serial input (was: mouseX / width)
  const maxDiameter = min(width, height);
  // let shapeFraction = mouseX / width;  // <-- replaced by serial!
  let circleDiameter = maxDiameter * shapeFraction;
  circle(xCenter, yCenter, circleDiameter);
}
And that’s it! We did it! You can view, edit, and run CircleSizeIn in the p5.js online editor or via GitHub (live page, code).
CircleSizeIn video demonstration
Here’s a video demonstration:
Video. The p5.js app CircleSizeIn (live page, code), which receives serial input from the Arduino running AnalogOut.ino. We use a potentiometer on Pin A0. Note: in this video, we use AnalogOutOLED.ino to also show the data on the OLED.
Other sensors as input
Of course, we can hook up whatever sensor we want as input. Below are demonstrations with a force-sensitive resistor and an infrared distance sensor.
CircleSizeIn with FSR
Video. CircleSizeIn (live page, code) with a force-sensitive resistor (FSR) on Pin A0 and Arduino running AnalogOutOLED.ino.
CircleSizeIn with IR distance sensor
Video. CircleSizeIn with the Sharp GP2Y0A21YK infrared distance sensor (analog output: 3.1V at 10cm to 0.4V at 80cm). Because the IR sensor is noisy, we used SharpIRDistanceOutOLED.ino with a moving average filter to smooth the input.
Simple real-time graph
Once we get the data into p5.js, we can really do anything we want: use the input to change colors, play a game, make a visualization, and more!
Recall in our OLED lesson that we built a real-time analog graph. During that lesson, we alluded to how that graph replicated a famous Processing example but self-contained on the Arduino. Now we can build that Processing example in p5.js!
On the Arduino side, we use the exact same code (AnalogOut.ino) as before—the Arduino simply reads analog data and transmits it via serial. We just need a new p5.js app. Let’s call it GraphIn.
Writing GraphIn in p5.js
Begin with the same p5.js serial template: copy SerialTemplate and rename the folder to GraphIn.
We’re going to use a queue to temporarily store data coming off serial, then read from and empty that queue in draw(). For each new value, we draw a representative line at an ever-increasing x-pixel position (xPos). When we reach the canvas width, we reset xPos and start over.
The full code is ~50 lines:
let serial; // the Serial object
let serialOptions = { baudRate: 115200 };
let queue = [];
let xPos = 0;
let pHtmlMsg; // optional <p> element for status messages

function setup() {
  createCanvas(750, 420);

  // Setup Web Serial using serial.js
  serial = new Serial();
  serial.on(SerialEvents.DATA_RECEIVED, onSerialDataReceived);

  // If we have previously approved ports, attempt to connect with them
  serial.autoConnectAndOpenPreviouslyApprovedPort(serialOptions);

  // Add in a lil <p> element to provide messages. This is optional
  pHtmlMsg = createP("Click anywhere on this page to open the serial connection dialog");

  background(50);
}

function draw() {

  while(queue.length > 0){
    // Grab the least recent value of queue (first in first out)
    // JavaScript is not multithreaded, so we need not lock the queue
    // before reading/modifying.
    let val = queue.shift();
    let yPixelPos = height - val * height;

    // Spruce up the color a bit by dynamically setting the line
    // color based on the current sensor value
    let redColor = val * 255;
    stroke(redColor, 34, 255); //set the color
    line(xPos, height, xPos, yPixelPos);

    xPos++;
  }

  if(xPos >= width){
    xPos = 0;
    background(50);
  }
}

function onSerialDataReceived(eventSender, newData) {
  pHtmlMsg.html("onSerialDataReceived: " + newData);

  // JavaScript is not multithreaded, so we need not lock the queue
  // before pushing new elements
  queue.push(parseFloat(newData));
}

function mouseClicked() {
  if (!serial.isOpen()) {
    try {
      serial.connectAndOpen(null, serialOptions);
    } catch (error) {
      console.error("Serial connection failed:", error);
    }
  }
}
That’s it! Pretty amazing, huh?! You can view our implementation as a live page or on GitHub.
GraphIn video demonstration
Here are two video demonstrations: one with a potentiometer and the other with the Sharp IR distance sensor.
Video. GraphIn (live page, code) with a potentiometer on Pin A0. The Arduino is running AnalogOutOLED.ino but something simpler like AnalogOut.ino would work too!
And here’s a demonstration with the Sharp IR distance sensor:
Video. GraphIn (live page, code) with the Sharp GP2Y0A21YK infrared distance sensor. We used SharpIRDistanceOutOLED.ino, which uses a moving average filter to smooth the noisy IR signal.
Lesson Summary
In this lesson, you learned about Processing and p5.js—creative coding tools that make it easy to build interactive graphics—and how to use them with Web Serial to receive data from Arduino. Here are the key takeaways:
- Processing (2001, Java) and p5.js (2013, JavaScript) are creative coding environments that make graphical programming accessible. The Arduino IDE is actually based on Processing!
- p5.js 2.0 is in transition (default in the editor by summer 2026). Our serial communication code works on both 1.x and 2.0, but we pin to 1.x for stability.
- The
setup()/draw()pattern in p5.js mirrors Arduino’ssetup()/loop()—familiar territory! - For serial input (
Arduino → Computer), the Arduino sends normalized data (e.g., a float between 0 and 1) viaSerial.println(), and the p5.js app receives it via theonSerialDataReceivedcallback. - We use a data queue pattern to bridge the gap between serial events (which can fire at any time) and
draw()(which runs at ~60fps). This prevents dropped data. - Any analog sensor can be an input—potentiometers, force-sensitive resistors, distance sensors—as long as the Arduino normalizes and transmits the data.
Exercises
Exercise 1: Modify the CircleSizeIn example to also change the circle color based on the incoming serial value. Map the value to a color using p5.js’s lerpColor() function—for example, transitioning from blue (value = 0) to red (value = 1).
Exercise 2: Create a p5.js app that reads two comma-separated sensor values from Arduino (e.g., "0.5,0.3\n") and uses them to control the x and y position of a circle. You’ll need to split the incoming string with newData.split(",") and parse each part.
Exercise 3: Extend the GraphIn example to be a scrolling graph instead of one that resets when it reaches the right edge. Use an array to store the most recent N values and shift the display left as new values arrive.
Exercise 4: Build a “sound level meter” p5.js app that reads an analog value from a sound sensor or microphone breakout board and displays it as a vertical bar that grows and shrinks in real time. Add color thresholds (green for quiet, yellow for medium, red for loud).
Next Lesson
In the next lesson, we’ll build more complex examples where Arduino and p5.js bidirectionally communicate (Computer ↔ Arduino). It should be fun! 🚀